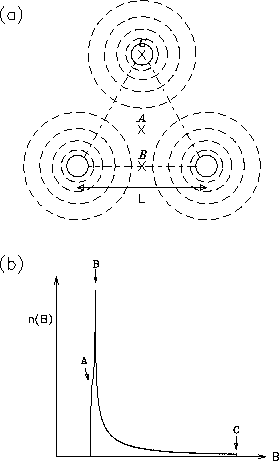
The vortex lattice in a type-II superconductor results in a spatially
varying magnetic field
![]() inside the superconductor. Transverse
-field muon spin rotation (TF-
inside the superconductor. Transverse
-field muon spin rotation (TF-![]() SR) can be utilized to investigate
the local magnetic field distribution function [72,77]:
SR) can be utilized to investigate
the local magnetic field distribution function [72,77]:
A: the minimum value of
![]() which occurs at the center of the
vortex lattice.
which occurs at the center of the
vortex lattice.
B: the saddle point value of
![]() which occurs midway between
two vortices.
which occurs midway between
two vortices.
C: the maximum value of
![]() which occurs at the vortex cores.
which occurs at the vortex cores.
 |
The average local magnetic field
strength inside the superconductor is denoted
![]() .
The spatial average of B is just the first moment of
n(B) [73]:
.
The spatial average of B is just the first moment of
n(B) [73]:
If the applied field
![]() then the London model is valid. At
such fields the spacing L between adjacent vortices is large compared
to the coherence length. In the
London theory, the local magnetic field
in an isotropic superconductor is given as [68]:
then the London model is valid. At
such fields the spacing L between adjacent vortices is large compared
to the coherence length. In the
London theory, the local magnetic field
in an isotropic superconductor is given as [68]:
At high fields the second moment decreases with increasing applied field Has the vortex cores start to overlap. The second moment at such fields can
be estimated by using Abrikosov's numerical solution of the GL-equations
for
![]() :
:
In London theory, where ![]() is assumed to be zero,
the local magnetic field in the center of a vortex is
not finite. To get around this divergence, Brandt [34,72]
approximates the vortex core by a gaussian function of width
is assumed to be zero,
the local magnetic field in the center of a vortex is
not finite. To get around this divergence, Brandt [34,72]
approximates the vortex core by a gaussian function of width ![]() ,
which provides a dome-shaped peak for the field. An
additional term (1-b) can be incorporated to roughly account for the
field dependence of the superconducting order parameter [76].
As in Eq. (3.8) this term is significant for applied
fields close to the upper critical field Hc2, leading to a
noticeable reduction in the width of the magnetic lineshape. Including
this effect, the vortex core can be approximated by a gaussian function
of width
,
which provides a dome-shaped peak for the field. An
additional term (1-b) can be incorporated to roughly account for the
field dependence of the superconducting order parameter [76].
As in Eq. (3.8) this term is significant for applied
fields close to the upper critical field Hc2, leading to a
noticeable reduction in the width of the magnetic lineshape. Including
this effect, the vortex core can be approximated by a gaussian function
of width
![]() .
Thus, according to Brandt
[34,72,76],
one can modify Eq. (3.5) so that the local magnetic field
of an isotropic superconductor for applied fields
H < Hc2/4 is
.
Thus, according to Brandt
[34,72,76],
one can modify Eq. (3.5) so that the local magnetic field
of an isotropic superconductor for applied fields
H < Hc2/4 is
The second exponential in Eq. (3.9) introduces an upper
cutoff for the reciprocal lattice vectors at
![]() [77]. This value emerged from Brandt's numerical solution
of the GL-equations [34,72]. The upper cutoff for
[77]. This value emerged from Brandt's numerical solution
of the GL-equations [34,72]. The upper cutoff for ![]() leads to a finite value of the local field B at
the vortex core. Fig. 3.2
illustrates the field distribution
leads to a finite value of the local field B at
the vortex core. Fig. 3.2
illustrates the field distribution
![]() as determined
by Eq. (3.9) for the average internal magnetic fields
as determined
by Eq. (3.9) for the average internal magnetic fields
![]() =5kG and 15kG. As the field is increased, the distance
between vortex cores decreases. Also the difference between the
maximum and minimum field in the distribution decreases with increasing
applied field. Fig. 3.3 shows the effects on the field
distribution of increasing the magnetic penetration depth
=5kG and 15kG. As the field is increased, the distance
between vortex cores decreases. Also the difference between the
maximum and minimum field in the distribution decreases with increasing
applied field. Fig. 3.3 shows the effects on the field
distribution of increasing the magnetic penetration depth ![]() ,
while Fig. 3.4 illustrates the dependence on the
GL-parameter
,
while Fig. 3.4 illustrates the dependence on the
GL-parameter ![]() .
.
The variation of the supercurrent density
![]() with
position
with
position ![]() from the vortex centre can be determined by
substitution of Eq. (3.9) into Eq. (2.3).
Fig. 3.5 illustrates the dependence of the absolute value
of the supercurrent density distribution on magnetic field.
The supercurrent density is zero at the centre of a vortex core, corresponding
to the maximum in the field distribution; Js rises steeply to its
maximum value at the edge of the vortex core and then falls off
exponentially. The singularity observed halfway between two vortices
denotes a change in the flow direction of the supercurrents.
from the vortex centre can be determined by
substitution of Eq. (3.9) into Eq. (2.3).
Fig. 3.5 illustrates the dependence of the absolute value
of the supercurrent density distribution on magnetic field.
The supercurrent density is zero at the centre of a vortex core, corresponding
to the maximum in the field distribution; Js rises steeply to its
maximum value at the edge of the vortex core and then falls off
exponentially. The singularity observed halfway between two vortices
denotes a change in the flow direction of the supercurrents.
Fig. 3.8 shows the dependence of the average value of the
supercurrent density
![]() on the average field
on the average field
![]() for
for
![]() .
As the applied field (
.
As the applied field (
![]() )
is increased above the lower
critical field, the average supercurrent density rises steeply. This is
because the supercurrents which screen the vortex cores have less
room to spread out at higher fields when the cores are closer together.
However, as shown in Fig. 3.8, the relationship is not
linear. This is due to the overlapping of vortices, which tends
to reduce
)
is increased above the lower
critical field, the average supercurrent density rises steeply. This is
because the supercurrents which screen the vortex cores have less
room to spread out at higher fields when the cores are closer together.
However, as shown in Fig. 3.8, the relationship is not
linear. This is due to the overlapping of vortices, which tends
to reduce
![]() .
As the field is increased, the inter-vortex separation decreases.
Eventually the overlapping of vortices
dominates the contribution to the average supercurrent density and the
curve turns over, so that
.
As the field is increased, the inter-vortex separation decreases.
Eventually the overlapping of vortices
dominates the contribution to the average supercurrent density and the
curve turns over, so that
![]() decreases with further increase
in the applied magnetic field. Interestingly, the turnover in
Fig. 3.8 occurs around 50kG; the maximum field at which Rammer
claims Eq. (3.6) is valid [32].
The dependence of the supercurrent
distribution on
decreases with further increase
in the applied magnetic field. Interestingly, the turnover in
Fig. 3.8 occurs around 50kG; the maximum field at which Rammer
claims Eq. (3.6) is valid [32].
The dependence of the supercurrent
distribution on ![]() and
and ![]() can be seen in Fig. 3.6
and Fig. 3.7, respectively.
can be seen in Fig. 3.6
and Fig. 3.7, respectively.
As mentioned in the previous chapter, the orientation of the applied field
with respect to the crystallographic axes
of the superconductor is important. For an applied field
parallel to the c-axis, the second moment of n(B) valid at intermediate
fields can be written as [66]
 |