Swimming world records (freestyle) are set on two "courses" - short and long, referring to the length of pool used for the event - 25m and 50m (Olympic). So there are two WRs for each distance, the main difference between them is the number of turns which have to be made - see table below.
| Short Course (25m) | Long Course (50m) | |||||
|---|---|---|---|---|---|---|
| Distance(m) | No. turns | Men(s) | Women(s) | No. of turns | Men(s) | Women(s) |
| 50 | 1 | 21.5 | 24.2 | 0 | 21.8 | 24.5 |
| 100 | 3 | 46.7 | 53.0 | 1 | 48.2 | 54.0 |
| 200 | 7 | 103.6 | 114.1 | 3 | 106.6 | 116.7 |
| 400 | 15 | 220.4 | 240.0 | 7 | 223.8 | 243.8 |
| 800 | 31 | 454.9 | 495.3 | 15 | 466.0 | 496.2 |
| 1500 | 59 | 866.5 | 943.3 | 29 | 881.6 | 952.1 |
We see that all of the short course records are faster than the long course ones - so there is a benefit from each turn. The simplest way to estimate this is to take the average of the differences between the LC and SC WRs, each divided by the difference in number of turns for that distance. This gives the advantage of turning to be about 0.5s/turn.
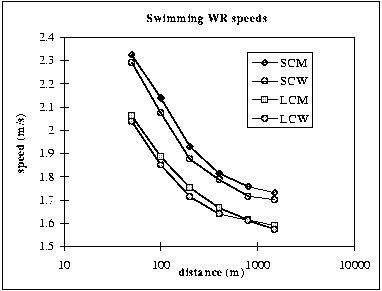
As for athletics data, time is not the best way to look at these records, since we know that longer distances take longer - we expect twice the distance to take at least twice the time. Instead we look at speed in the plot below, measured in m/s (plot also available as EPS).

This shows that speed decreases with distance, as we expect, though we cannot see this from the times, which increase almost linearly.
To compare your times at different distances, you use these records - basically you see how the world record speeds decrease with distance and divide your result by this to get a percentage of the WR speed. This can then be compared for any distance.
In the case of running world records, we smoothed out the variation between distances using a model for the shape of the curve. Swimming records don't cover a great range of distances and the plot (above) looks reasonably smooth anyway, so rather than fit a model, we can just use the actual world records for comparison with your times.
The tables calculated using a spreadsheet give a simple way of looking up your performance at each distance, compared to the WR.